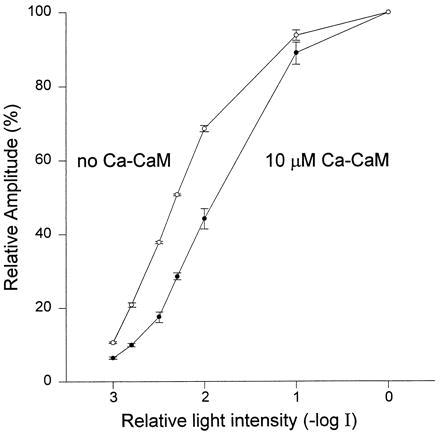
Figure 4.

Application of Ca–CaM into P[ninaCΔB] cells shifts the intensity-response function to stronger lights. Normalized peak LIC of cells bathed in normal medium is plotted against increasing intensities of 500-ms white flashes with 1-min interval between test pulses (halogen lamp, which provided transillumination, log I = −2.5 was equivalent to log I = −1.0 of the orange lights used in the other figures). The effect of internal dialysis of Ca–CaM (10 μM CaM and 20 μM Ca2+) was measured 2 min after formation of whole-cell recordings (•, n = 6) and compared with the intensity-response curve measured before application of Ca–CaM (○, n = 6). All the current traces were normalized to the averaged peak amplitude of the untreated cells in response to maximal intensity white light (the averaged maximal amplitude was 6.9 nA for untreated cells and 6.8 nA for treated cells).
