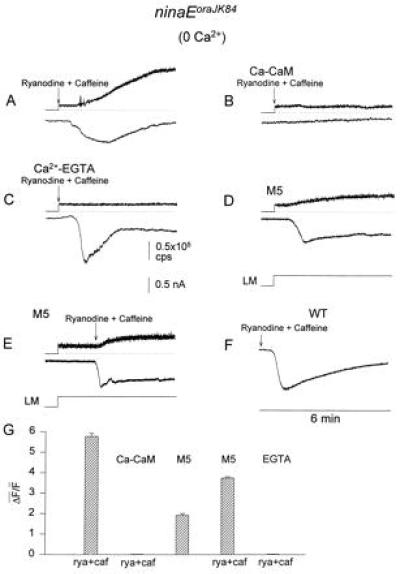
Figure 5.

Ryanodine plus caffeine, either alone or with M5, induces an inward current (ISOC, lower traces) and Ca2+ release from internal stores in ninaEoraJK84 flies (upper traces). Ca2+-free medium was used (0.2 mM EGTA). The fluorescence data were sampled at 30 samples per second and are presented in counts per second. M5, Ca–CaM and EGTA were included in the recording pipette. A large variability in the waveform and peak amplitude of ISOC was found in the various experiments. (A) Application of 4 μM ryanodine plus 10 mM caffeine. (B) Inclusion of 5 μM CaM plus 10 μM Ca2+ in the pipette prevented the ryanodine plus caffeine-induced current and the increase in cytosolic Ca2+. Experimental conditions as Fig. A. Only the first 6 min of the 12-min recordings are shown. (C) Internal dialysis with Ca-EGTA buffer (5 mM Ca2+ and 10 mM EGTA), which buffered the cell to an ≈200 nM Ca2+ (14), followed by bath application of ryanodine plus caffeine prevented the increase in cellular Ca2+ but not the induction of ISOC. (D) Application of M5 produced an inward current in the dark which was accompanied by an increase in fluo-3 fluorescence. Experimental paradigm similar to A except that 100 μM M5 was applied through the pipette. Formation of whole-cell recordings started 4 min before the beginning of the trace in D. The inward current was accompanied by an increase in fluo-3 fluorescence in four cells. In one cell, the inward current was approximately two times slower and smaller and no increase in fluorescence was observed. (E) M5 accelerates the ryanodine plus caffeine-induced current. Experimental paradigm similar to that of A except that 100 μM M5 was applied through the recording pipette for 2 min and then ryanodine plus caffeine were applied to the bath. The inward current was induced within 20 s. (F) Application of 4 μM ryanodine plus 10 μM caffeine to WT cells in the dark induced ISOC (n = 6). Experimental paradigm similar to A except that fluo-3 was not included in the recording pipette and cells were maintained in darkness during the entire experiment. (G) Quantitative summary of the fluorescent measurements of ninaEoraJK84 cells (traces in A–E above). To estimate the release of Ca2+ from intracellular stores by ryanodine (rya) plus caffeine (caf), the geometrical average ΔF̄/F̄ was calculated. The bar graphs show the geometrical average of the ΔF/F ratios calculated from different cells (4–6 cells). Control experiments in which the Ca2+-insensitive dye, fluorescein, was used instead of fluo-3 indicated that the increase in fluorescence was not due to volume changes.
