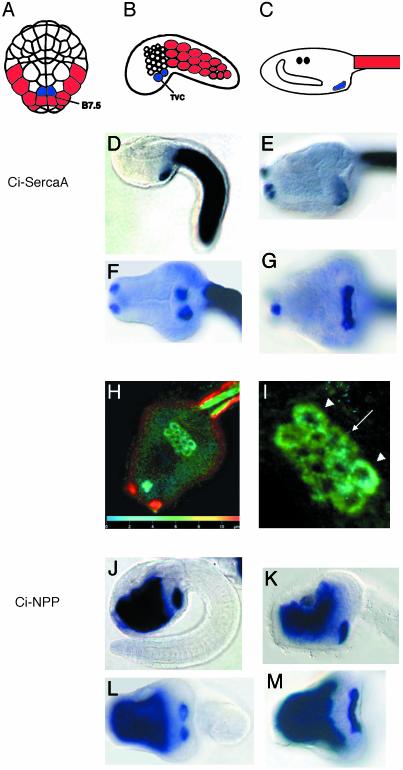
Fig. 1.
Gene expression in the heart lineage. (A–C) Diagrams of Ciona embryos and larvae. Tail muscle myoblasts are red, and heart lineage cells (TVCs) are blue. The anterior is up (A) to the left (B and C). (D–M) Ciona larvae stained with antisense RNA probes for Ci-SercaA (ci0100137099, clone ID no. GC29o11) (D–I) and Ci-NPP (ci0100144439, clone ID no. GC29e18) (J–M). The top rows are side views of tailbud embryos (D and J) and larval heads (E and K). The bottom rows are ventral views of tailbud embryos (F and L) and larval heads (G and M). (H) Ventral view of larva hybridized to Ci-SercaA and stained with Fast red. Projections of confocal z series false colored to represent depth are shown (scale on the z axis is indicated on bar at the bottom of the image). (I) Closeup (from H) of emerging heart field. Arrowheads point to four large outer cells, and the arrow points to inner cluster of eight smaller cells. To obtain sequence information, use the gene numbers provided above to search within the annotation section (http://genome.jgi-psf.org/ciona4/ciona4.home.html), or use the clone ID no. to search the EST site (http://ghost.zool.kyoto-u.ac.jp/indexr1.html).

