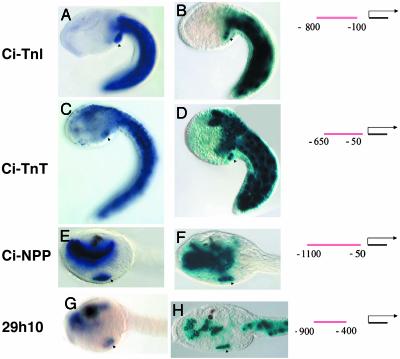
Fig. 3.
Enhancers for Ciona heart genes. (A, C, E, and G) In situ staining for four probes, as indicated to the left, Ci-TnI (ci0100137955, clone ID no. GC29b15), Ci-TnT (ci0100146672, clone ID no. GC26c17), Ci-NPP, and 29h10 (ci0100135212, named after clone ID no. GC29h10). (B, D, F, and H) Corresponding lacZ reporter assays for regulatory DNA located upstream of the relevant genes. Diagrams to the right indicate the position of the tested fragment relative to the predicted transcriptional start site of the relevant gene. Note staining of the TVC progeny in all images (arrowheads). Note staining in the tail muscle in A–D, staining in the endoderm in E–H, and staining of the CNS in C–D. Also note that the 29h10 enhancer drives expression in the tail muscle (H), although this is not seen in the endogenous expression pattern (G). (A–D) Side view of tailbud embryos. (E–H) Side view of larval heads. The anterior is to the left in all images.

