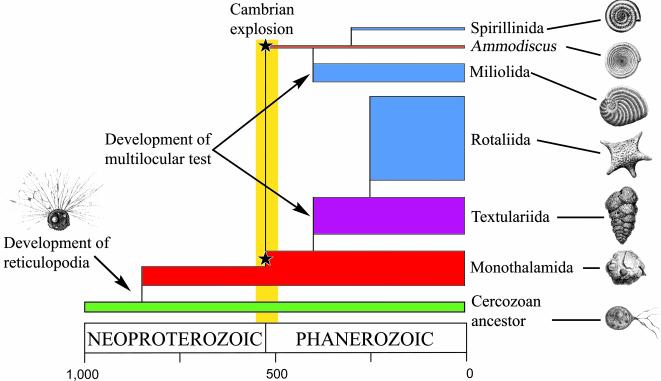
Fig. 3.
Time scale of early foraminiferal evolution based on combined molecular and fossil data, highlighting the development of reticulopodia at the origin of the group, and the independent development of a multilocular test in the lineages leading to Textulariida + Rotaliida and Spirillinida + Miliolida. Only the taxonomic groups for which molecular data exist are illustrated. The height of each rectangle is proportional to the number of recognized families in the clade, or to the number of different genetic lineages in the case of Monothalamida. Stars indicate the fossil appearance of some unilocular lineages.

