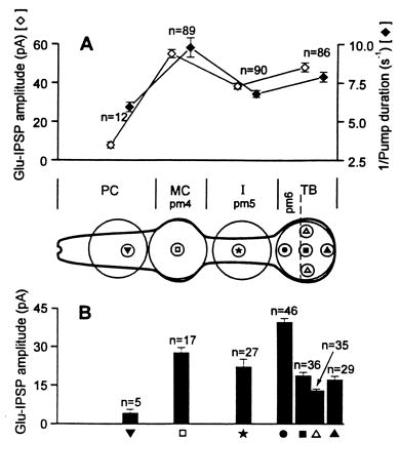
Figure 4.

The diagram of the pharynx inserted between A and B shows the areas that were illuminated in the photolysis experiments. The large circles correspond to an illuminated area of 35 μm diameter (similar to the size of the TB of the adult hermaphrodite nematode which was used for EPG recording). The small circles correspond to an area of 7 μm. (A) The illuminated area is indicated by the large circles. The open (⋄) and solid (♦) diamonds represent the Glu-IPSP current amplitude and the reciprocal of pump duration, respectively. Caged glutamate was photolyzed in different locations (large circles) (PC, MC, I, and TB) of the C. elegans pharynx. All data were collected from eight nematodes. (B) The photolytic area is indicated by the small circles in the diagram of the pharynx. The current amplitudes of the Glu-IPSPs are shown. All data were collected from five nematodes in the experiments. The error bar is the SEM, and n is the total number of measurements. Statistical analysis of the current amplitude of Glu-IPSP [Wilcoxon’s two-sample test, two tailed, (29, 30)]: in A, MC vs. PC, MC vs. I, I vs. PC, and TB vs. PC, P < 0.002; MC vs. TB and TB vs. I, 0.02 > P > 0.002; in B, • is significantly different from other data points, P < 0.002.
