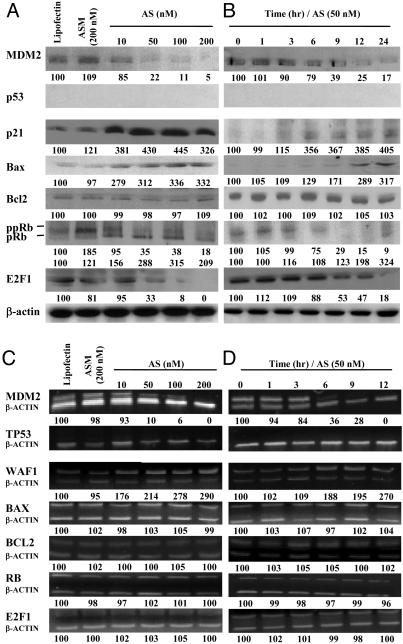
Fig. 5.
Protein (A and B) and mRNA (C and D) levels of various genes in PC3 cells treated with Oligo AS or controls. The assay conditions were the same conditions as described for Fig. 3, except for the concentration of Oligo AS used in B and D (50 nM).

