
Figure 2.
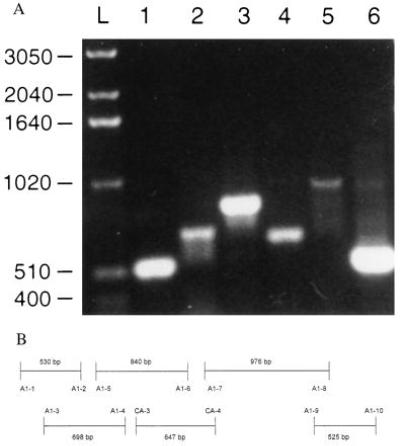
Agarose gel with PCR products that cover the entire coding region of the Na,K-ATPase α1 isoform. PCR reaction products were loaded onto a 1.2% Agarose gel. The primer pairs noted below are defined in Table 1. (A) Lanes: L, a 1-kb mass ladder (Life Technologies); 1, primer pair A1-1 and A1-2; 2, primer pair A1-3 and A1-4; 3, primer pair A1-5 and A1-6; 4, primer pair CA-3 and CA-4; 5, primer pair A1-7 and A1-8; 6, primer pair A1-9 and A1-10. (B) A scheme of the overlapping PCR products representing the entire coding region of the α1 isoform. Each primer pair is identified together with its respecting coding region of the α1 subunit.