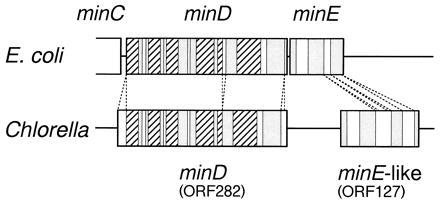
Figure 2.

Schematic representation of the similarity between Chlorella ORF282/ORF127 and E. coli minD/minE. The gene arrangement and a comparison of their deduced amino acid sequences are shown. The hatched, shaded, and open areas represent identities of >50%, 30–50%, and <30%, respectively.
