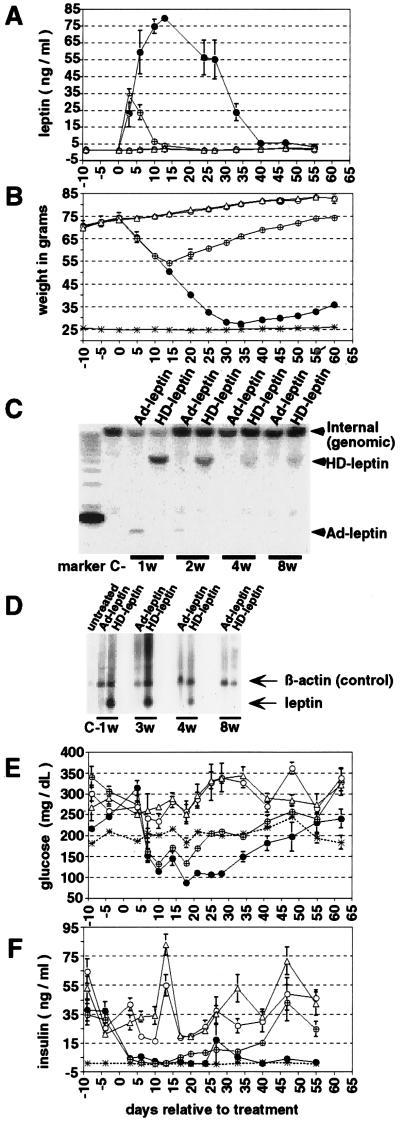
Figure 5.
HD-leptin and Ad-leptin effects in ob/ob mice. Essentially as described in Fig. 4, animals were injected in the tail vein with a single dose of 1–2 × 10¹¹ particles of HD-leptin (n = 5), Ad-leptin (n = 10), and Ad-β-gal (n = 10), or the equivalent volume of dialysis buffer (n = 10). Lean control values are plotted for comparison. The time course shows (A) serum leptin levels (ng/ml, mean ± SEM), collected 2–3 times; (B) weight (g, mean ± SEM). (C) Southern blot analysis, the arrows refer to the single HD-leptin and Ad-leptin bands. Three internal genomic bands were also detected in treated and control DNA: one strong (uppermost, >12 kb), and two faint (lower) bands. (D) Total RNA from livers of Ad-leptin-treated and HD-leptin-treated mice at 1-, 2-, 4-, and 8-week intervals, and in untreated mice. Arrows refer to the leptin message (≈500 bp) band, β-actin was used as the internal control (≈1 kb). (E and F) Serum glucose (mg/dl) and insulin (ng/ml) were measured in all animal groups (mean ± SEM).

