Figure 1.
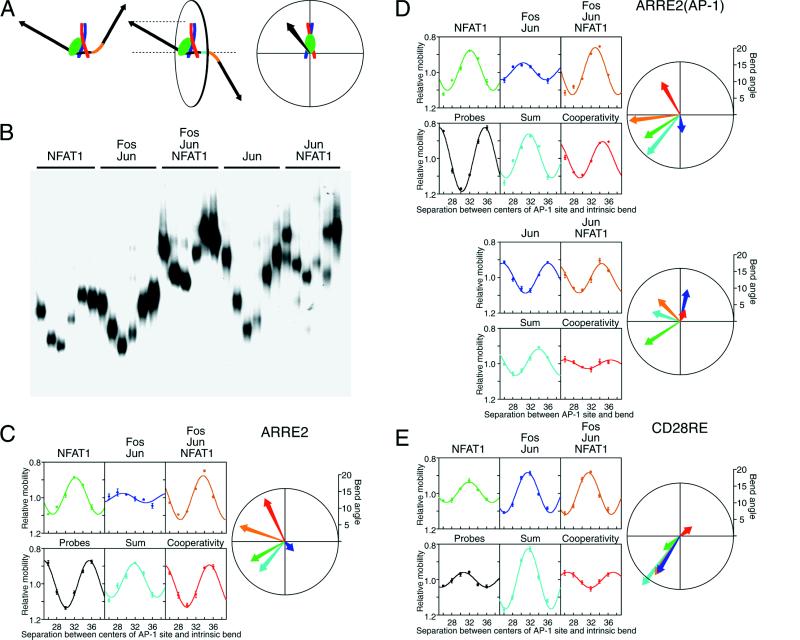
DNA bending cooperativity in complexes formed by the DNA binding region of NFAT1 and the bZIP domains of Fos and Jun. (A) Schematic representation of phasing analysis and the polar representation of DNA bending. The two diagrams on the left represent NFAT1—Fos–Jun complexes (NFAT1, green; Fos, red; Jun, blue) that differ in the spacing (cyan) between the protein-induced and intrinsic (orange) DNA bends. When the bends are in phase (left complex), the overall bend is larger, and the electrophoretic mobility is lower than when the two bends are out of phase (middle complex). The diagrams on the right describe the polar representation of DNA bending, which is equivalent to the projection of the bent DNA helix onto a plane perpendicular to the DNA helix axis between the AP-1 site and the intrinsic bend. The orientation and length of the vector show the direction and magnitude of the protein-induced DNA bend (16). (B) Phasing analysis of DNA bending by Fos(139–200)–Jun(257–318) heterodimers and Jun(241–334) homodimers in the presence and absence of NFAT1(396–692). The proteins indicated above the lanes were incubated with DNA fragments that differ in the spacing between the ARRE2(AP-1) site and the intrinsic bend (26, 28, 30, 32, 34, and 36 bp), and the complexes were analyzed by PAGE. (C) Quantitation of DNA bending by complexes formed by NFAT1, Fos, and Jun at the ARRE2 site. The mobilities of the complexes were normalized for differences in probe mobilities and plotted as a function of the separation between the centers of the AP-1 recognition sequence and the intrinsic bend. The predicted additive effect of the bends induced by NFAT1 and Fos–Jun heterodimers separately is shown in the graph (cyan) below the Fos–Jun complex mobilities. The ratio between the relative mobilities of the NFAT1—Fos–Jun—ARRE2 complexes and the relative mobilities of complexes formed by NFAT1 and Fos–Jun separately reflects the contribution of bending cooperativity to complex mobility. This effect of bending cooperativity is shown in the graph (red) below the NFAT1—Fos–Jun—ARRE2 complex mobilities. The direction and magnitude of the DNA bend induced by each complex were calculated as described (16) and are shown together with the sum of the bends and the bending cooperativity in polar representation using the same colors that were used to plot their relative mobilities. (D) Quantitation of DNA bending by complexes formed by NFAT1, Fos, and Jun at the ARRE2(AP-1) site. (E) Quantitation of DNA bending by complexes formed by NFAT1, Fos, and Jun at the CD28RE site.

