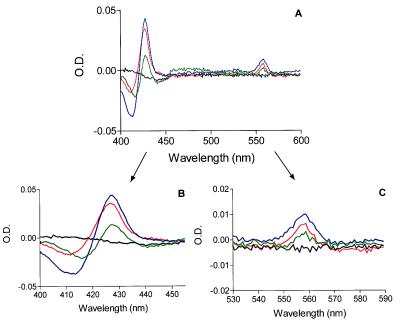
Figure 2.
Dithionite-reduced minus oxidized difference spectra of COS7-expressed flavocytochrome b558. (A) solubilized samples of COS7 p22 (black line), COS7 gp91 (green line), COS7 gp91/p22 (red line), and human neutrophil flavocytochrome b558 (blue line) were analyzed by difference spectroscopy as described under Materials and Methods. Samples of COS7 WT (not shown) had identical spectra to those shown for COS7 p22. (B and C) show enlarged views of the Soret- and α-band regions, respectively. Representative of triplicate analyses from three separate membrane preparations.

