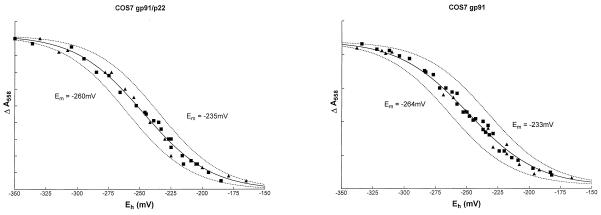
Figure 3.
Potentiometric titrations of solubilized COS7 gp91/p22 and COS7 gp91 membranes. Oxidation–reduction potential measurements were performed on COS7 gp91/p22 (Left) and COS7 gp91 (Right) membranes as described under Materials and Methods. Potassium ferricyanide was used for oxidative titrations (square), and sodium ditionite was used for reductive titrations (triangle). The solid curves are the best fits to the data points for two components; the dashed curves represent the contributions of the individual heme centers, each contributing ≈50% to the absorbance change. Data from the redox titrations was fitted by nonlinear regression (Marquardt method) to the Nernst equation by using graphpad Prism software. Initial estimated values for the variables were the maximum absorbance change of each component and its corresponding midpoint potential. The total absorbance change in both cases was ≈0.01 absorbance units.

