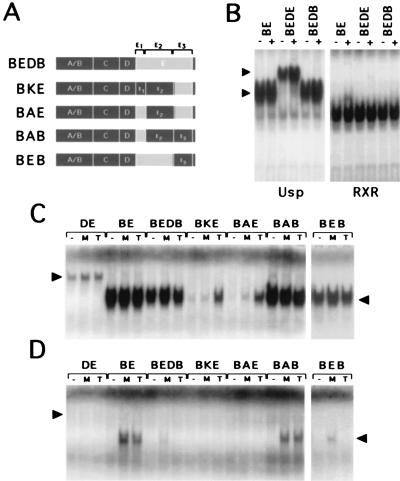
Figure 3.
Gel mobility shift analysis of EcR hormone-binding domain chimeras. (A) Schematics of chimeric receptors. Dark shading, BE sequences; light shading, DE sequences. E1, E2, and E3 indicate subdivisions of the E domain. (B) Gel mobility shift of native BE and the BEDE and BEDB chimeras with Usp and RXR heterodimer partners. On the left is indicated the size of BE and BEDB band shifts (lower arrowhead) and BEDE band shifts (upper arrowhead). Gel mobility shift of native and E-domain chimeric EcRs with Usp (C) or with RXR (D). Treatments were with vehicle (−), 1 μM murA (M), or 1 μM tebufenozide (T). The left arrow indicates the size of the native DE shift, and the right arrow indicates BE-sized shifted bands. The BEB chimeras are slightly separated from the other lanes because they were run simultaneously on a separate gel.

