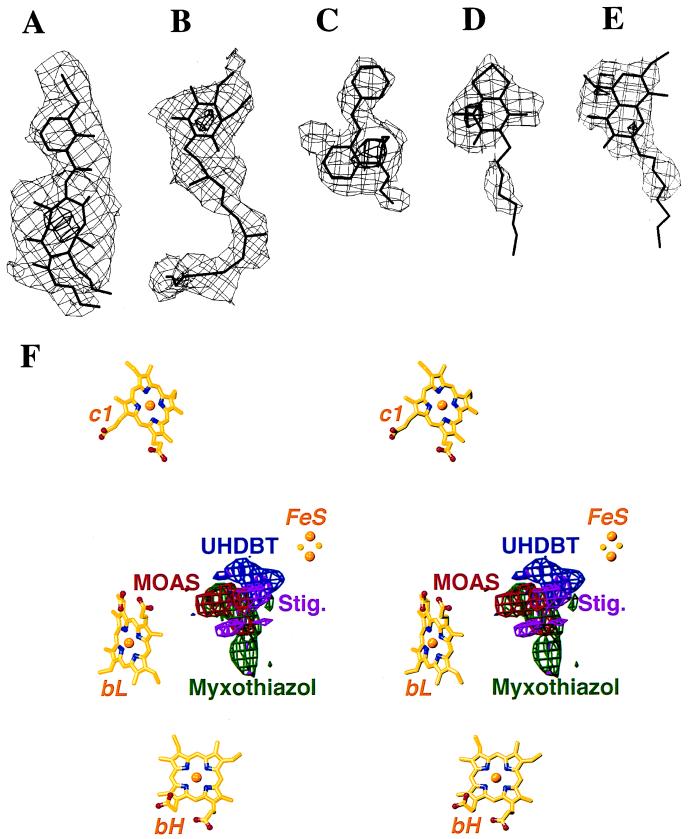
Figure 2.
(A–E) Difference electron densities between the inhibitor-bound and native crystals and atomic models of inhibitors and ubiquinone. The maps are contoured at two levels (thin and thick lines, respectively); contour levels for each map are listed in standard deviations from the mean. (A) Antimycin A (3, 20). (B) Ubiquinone (−3, −10). (C) MOA-stilbene (3, 8). (D) UHDBT (3, 7). (E) Stigmatellin (3, 5). (F) Stereo drawing: Models of redox cofactors together with superimposed difference-densities of four Qo inhibitors, viewed parallel to the membrane. MOAS, MOA-stilbene; Stig., stigmatellin.

