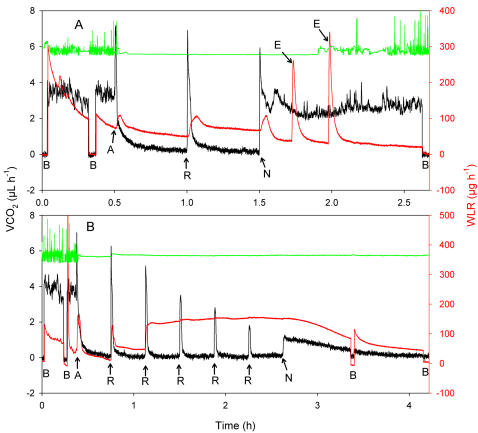
Figure 3. Effects of an oxygen reperfusion event followed by anoxia.
Typical effects of 60 minutes of anoxia, interrupted by A) 1 minute of reperfusion with normoxia after 30 minutes, or B) multiple, 1 minute durations of reperfusion with normoxia, on the CO2 emission rate (VCO2; black), water loss rate (WLR; red) and activity (green; no units shown) of a male Drosophila melanogaster at 25°C. B = baselines. A = initiation of anoxia. R = reperfusion for 1 minute. N = return to normoxia. E = excretion events in the water vapor trace (red) after return to normoxia (approximately 1.75 and 2 hours); note the fast rise-times of these events.

