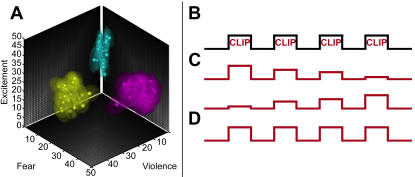
Figure 1. Stimuli and design.
(A) Each of the eighty-four clips was rated for violence, fear, and excitement on continuous visual analogue scales (n = 6 subjects). An overall Cronbach's α of 0.88 suggests high inter-rater reliability of stimulus evaluation. Solid spheres represent individual film clips, plotted on each dimension according to their mean rating, while translucent spheres indicate the standard error in each dimension. Spheres are colored according to category (yellow = violent, purple = fearful, blue = neutral). The centers of mass for the three clusters, on (V/F/N) coordinates, are: violent clips [44.4, 28.0, 28.8]; fearful clips [13.5, 43.4, 25.1]; neutral clips [2.5, 3.3, 25.1]. (B) Shown is a schematic of the experimental design, in which the individual film stimuli are presented sequentially with a fifteen second intervening fixation period. (C) To model linear changes in stimulus-evoked response and account for the maximum possible variance, regressors included both a decreasing and increasing function. The regressors were convolved with custom individualized hemodynamic response functions to create the design matrix. Three contrasts were evaluated, one for each regressor and one for their sum (constant activation, [D]). (Note: the actual design contained 24 events.)

