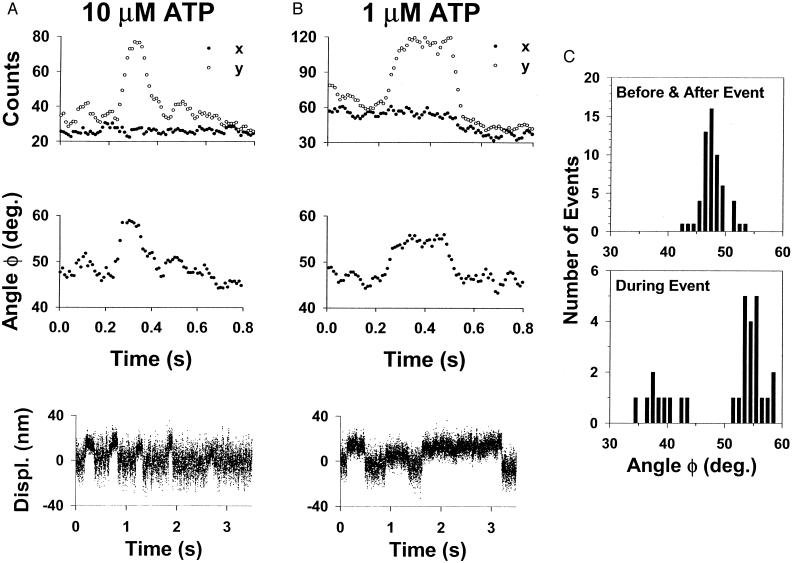
Figure 4.
Fluorescence polarization and unitary displacements as function of MgATP concentration and polarization angle histograms. (A Top and B Top) Examples of x- and y-polarized fluorescence emission signals initially collected at a 1-ms integration rate then resampled at a 10-ms rate and filtered by using a five-point moving average for 10 μm and 1 μM MgATP. (A Middle and B Middle) The x-y plane projected emission dipole polarization angles (φ) determined from the fluorescence emission signals in the traces above by using the equations in Methods. (A Bottom and B Bottom) Representative unitary displacement records from smooth muscle heavy meromyosin obtained under similar experimental conditions as in the fluorescence polarization experiment, using the laser optical trap. See Guilford et al. (20) for experimental details. Myosin generated displacements of ≈10 nm are seen as upward deflections in the traces. (C Histograms of the average φ determined both 100 ms before and after the polarization event (Upper) and during the event (Lower).

