
Figure 2.
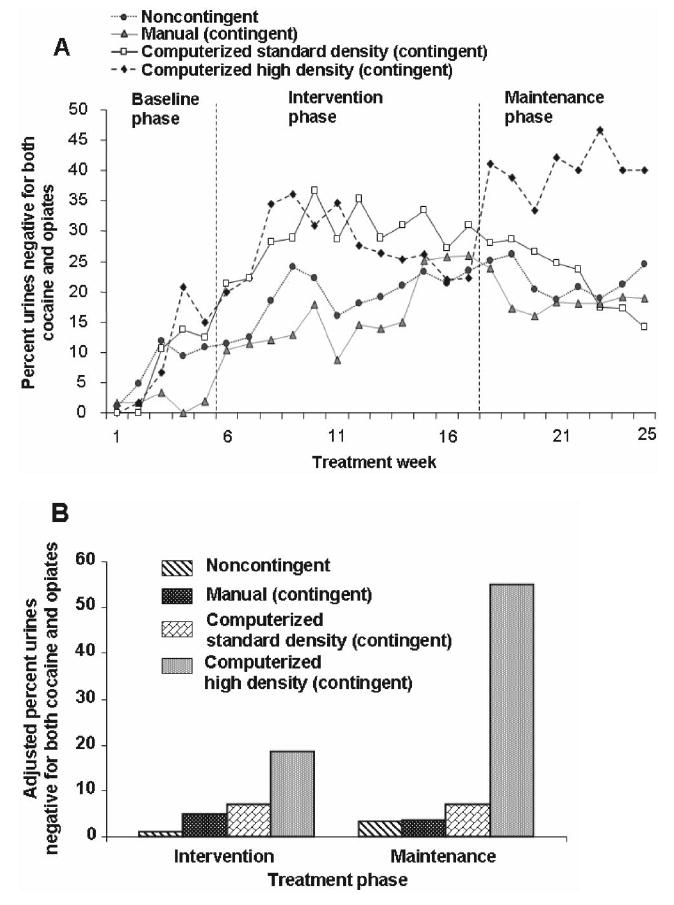
A: Mean raw percentages of urine specimens by treatment group that were negative from both cocaine and opiate use in the baseline phase (first 5 weeks), prize-drawing intervention phase (next 12 weeks), and maintenance/posttreatment (return-to-baseline) phase (final 8 weeks). The seeming group difference in baseline drug use is not statistically significant but is controlled for in the adjusted percentages shown in Panel B. B: Adjusted percentages of urine specimens by treatment group that were negative from both cocaine and opiate use in the prize-drawing intervention phase (12 weeks), and maintenance/posttreatment (return-to-baseline) phase (final 8 weeks). Each adjusted percentage is a μ value from a random-effects mixed-regression model (SAS GLIMMIX macro) controlling for baseline drug use—expressed as (a) the percentage of urine specimens negative for both opiates and cocaine, arcsine transformed; (b) negative for cocaine, arcsine transformed; and (c) negative for opiates, arcsine transformed—and for treatment duration (continuous variable: the number of the last urine specimen collected during the maintenance/postintervention phase of the study).