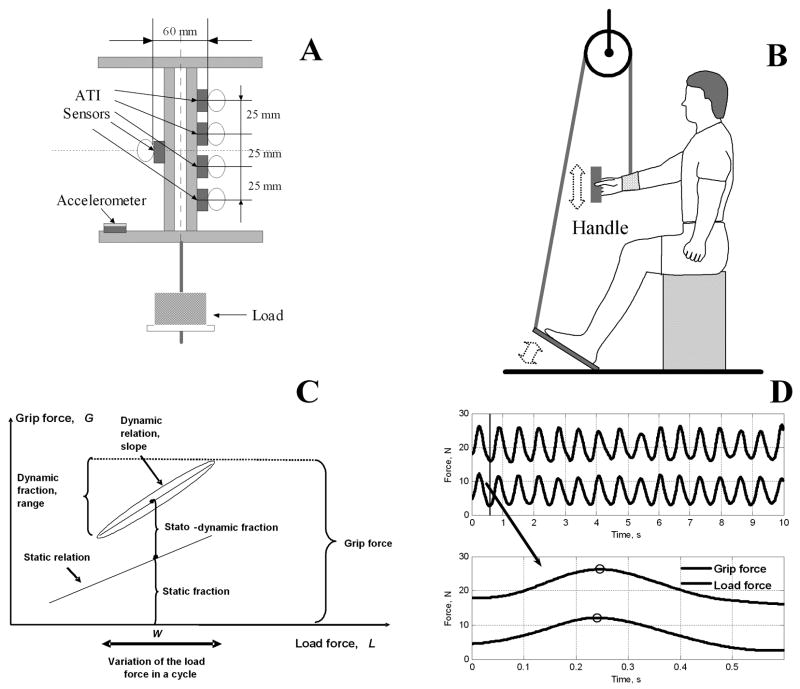
Figure 1.
Panel A. Schematic drawing of the handle. Panel B. Schematic drawing of the experimental setup. A pedal connected to a pulley system was used to pull the forearm. Panel C. Decomposition of the grasping force into the static, stato-dynamic and dynamic fractions. W is the object weight. The static relation is represented by a straight line. The dynamic relation is represented by an ellipse. Panel D. A typical grip force and load force (N) time histories with zoom-in of the upper panel. The peak values of the curves are labeled with circles and the time lag can be determined by calculating the time interval between the two peaks.

