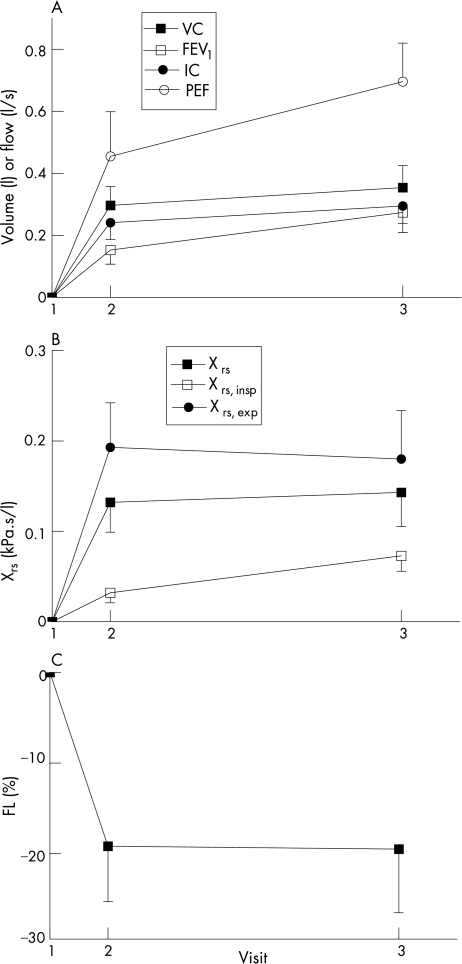
Figure 5 Time course of recovery of physiological variables. (A) Volumes and flows; (B) Xrs; (C) %FL. Values are mean change relative to visit 1. Error bars show SEM. FEV1, forced expiratory volume in 1 s; %FL, percentage flow limitation; IC, inspiratory capacity; PEF, peak expiratory flow; VC, vital capacity; Xrs, reactance of respiratory system.

An official website of the United States government
Here's how you know
Official websites use .gov
A
.gov website belongs to an official
government organization in the United States.
Secure .gov websites use HTTPS
A lock (
) or https:// means you've safely
connected to the .gov website. Share sensitive
information only on official, secure websites.
