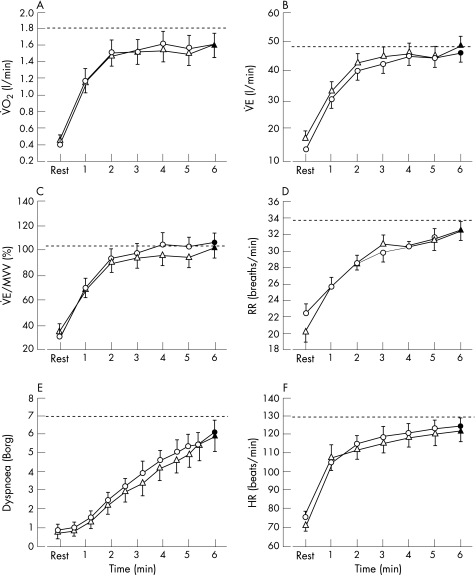
Figure 4 Cardiorespiratory response during the 6 min walking test (6MWT) under placebo (circles) and ipratropium bromide (triangles). Time course (open symbols) and end‐exercise (closed symbols) values are shown for (A) oxygen consumption (V̇o2), (B) minute ventilation (V̇E), (C) V̇E/maximal voluntary ventilation (MVV), (D) respiratory rate (RR), (E) dyspnoea, and (F) heart rate (HR). The dashed line represents the peak value achieved on the incremental shuttle walk. Values are mean (SE).

An official website of the United States government
Here's how you know
Official websites use .gov
A
.gov website belongs to an official
government organization in the United States.
Secure .gov websites use HTTPS
A lock (
) or https:// means you've safely
connected to the .gov website. Share sensitive
information only on official, secure websites.
