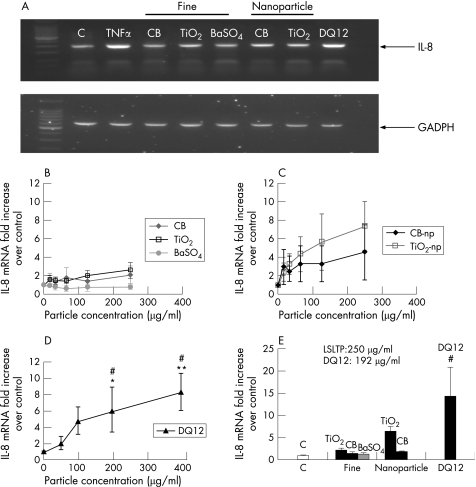
Figure 1 IL8 mRNA expression in A549 cells treated for 6 h or 24 h with fine particles, nanoparticles and DQ12 quartz. (A) Agarose gel showing IL8 mRNA intensity upon 6 h treatment with 10 ng/ml of TNFα, 250 µg/ml of fine particles (CB, TiO2, BaSO4) or nanoparticles (CB‐np and TiO2‐np) and 192 µg/ml of DQ12 quartz. (B) fine particles; (C) nanoparticles; and (D) DQ12 quartz. Graphs of dose–response in cells treated for 6 hours, showing mean and standard error from four experiments. #Cytotoxicity at these doses. Significant difference from control: *p<0.05 and **p<0.01. (E) Histogram for cells treated for 24 hours at 250 μg/ml for fine particles and nanoparticles, and at 192 μg/ml for DQ12.

An official website of the United States government
Here's how you know
Official websites use .gov
A
.gov website belongs to an official
government organization in the United States.
Secure .gov websites use HTTPS
A lock (
) or https:// means you've safely
connected to the .gov website. Share sensitive
information only on official, secure websites.
