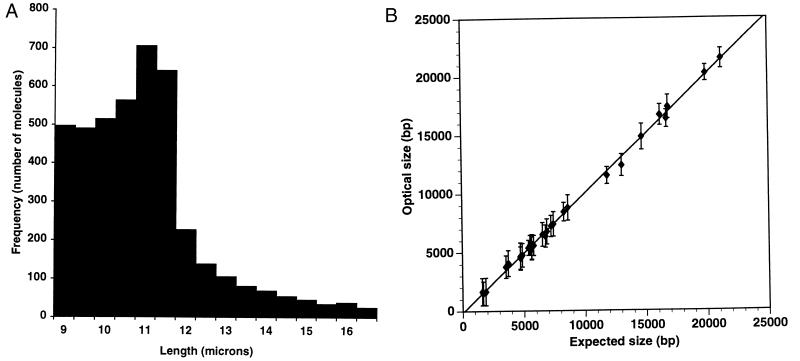
Figure 3.
Evaluations of optical mapping molecular parameters and sizing error. (A) Histogram of lengths of spotted adenovirus type 2 DNA molecules. Lengths of 4,242 molecules from 11 spots (49 images per spot) measured by OMM were pooled and analyzed. Histogram shows the fraction (33.4%) of molecules that are sufficiently elongated for mapping (≥65% of the full contour length). The remaining fraction is primarily completely relaxed molecules or “balls,” which randomly populate the spotted areas. The average molecular length is 10 μm. (B) Sizing precision and accuracy. Restriction fragment sizing results for lambda bacteriophage DNA obtained by optical mapping plotted against sequence data. Fragment sizes range from 1,602 to 21,226 bp. Error bars represent SD of the means. Lambda DNA spotted on an APTES surface was digested with ApaLI, AvaI, BamHI, EagI, or EcoRI. Ten to 30 images were collected from one spot and analyzed by OMM.

