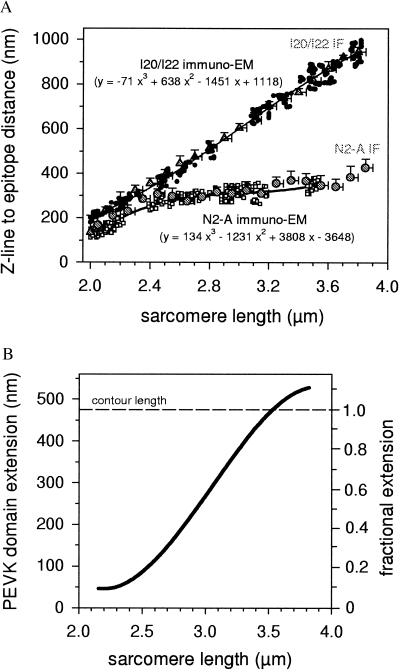
Figure 3.
Extension behavior of the PEVK segment. (A) Summary of results of immunolabeling experiments. Immunoelectron microscopy data points for the Z-line center to epitope spacing are shown for both N2-A (□) and I20/I22 (•). The larger shaded circles (and triangles) and error bars indicate the mean distances from the Z-disc center and SD for N2-A (and I20/I22, respectively), measured by immunofluorescence microscopy (IF). Curve fitting parameters (electron microscopy data only) also are shown. (B) Extension of the PEVK region vs. SL. The left axis indicates the region’s end-to-end length, the right axis fractional extension (relative to the segment’s assumed contour length of 476 nm).

