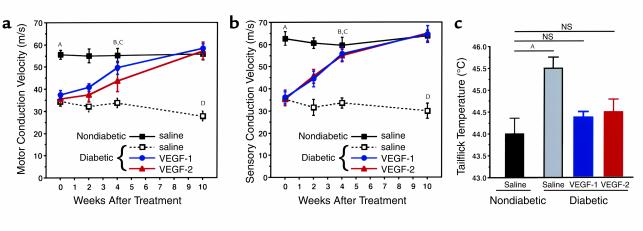
Figure 1.
Time course of MCV (a) and SCV (b). Female Sprague-Dawley rats weighing 240–260 g were injected intraperitoneally with streptozotocin at 50 mg/kg. Diabetes was confirmed by testing blood glucose the next day. Twelve weeks later, nondiabetic and diabetic rats were randomly assigned to a saline-injection control group, and to the treatment groups that underwent either VEGF-1 or VEGF-2 gene transfer (nondiabetic, saline injection, n = 5; nondiabetic, VEGF-1, n = 6; nondiabetic, VEGF-2, n = 5; diabetic, saline-injection, n = 9; diabetic, VEGF-1, n = 18; and diabetic, VEGF-2, n = 15). Sciatic nerve conduction measurements were performed at the time of treatment (week 0) and then at 2, 4, and 10 weeks. Data are expressed as mean ± SEM. AP < 0.01, nondiabetic saline versus diabetic saline, diabetic VEGF-1, or diabetic VEGF-2. BDiabetic VEGF-1 or diabetic VEGF-2 not significant versus nondiabetic saline. CP < 0.01, diabetic saline versus diabetic VEGF-1, diabetic VEGF-2, or nondiabetic. DP < 0.01, diabetic saline versus diabetic VEGF-1, diabetic VEGF-2, or nondiabetic. (c) Tailflick threshold temperatures 4 weeks after gene transfer. The temperature at which the rats demonstrated the characteristic tailflick response was tested for in a completely blinded fashion. Values are expressed as mean ± SEM. AP < 0.01. Nondiabetic, saline-injection, n = 5; diabetic, saline-injection, n = 9; diabetic, VEGF-1, n = 18; and diabetic, VEGF-2, n = 15.

