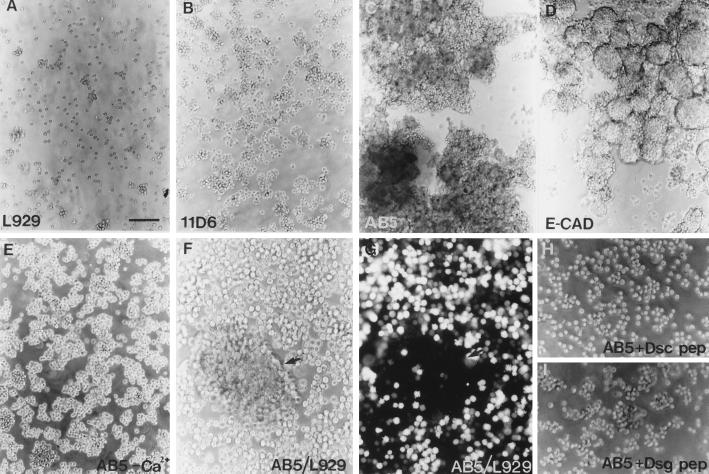
Figure 3.
Aggregation assays for cellular adhesion. (A) L929 cells. (B) 11D6 cells. (C) AB5 cells. (D) R16 cells. (E) AB5 cells in the absence of calcium. (F) Phase contrast of untransfected L cells (fluorescently labeled) and AB5 cells (unlabeled) after mixed aggregation. The aggregate (arrow) consists almost entirely of unlabeled AB5 cells, whereas when AB5 cells were fluorescently labeled and L929 cells were unlabeled the aggregates consisted almost entirely of labeled cells (results not shown). (G) Immunofluorescence of the same field of view. (H) AB5 cells in the presence of Dsc1 CAR peptide. (I) AB5 cells in the presence of Dsg1 CAR peptide. In B, cells were aggregated for 16 h.; in all other cases cells were aggregated for 1 h. (Bar = 80 μm in A, B, C, D, E, H, and I; bar = 40 μm in F and G.)

