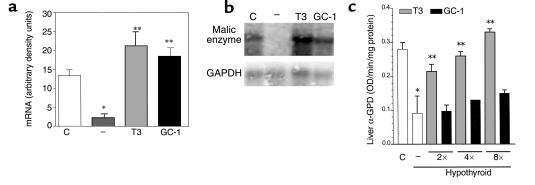
Figure 4.
Markers of T3 or GC-1 actions in the liver. (a) Malic enzyme mRNA was quantitated in euthyroid control animals (C), and hypothyroid animals treated with vehicle (–), T3, or GC-1. (b) Representative Northern blot of malic enzyme mRNA from liver. GAPDH mRNA expression was used for normalization. Densitometric analysis of mRNA expression is shown in arbitrary units (malic enzyme mRNA/GAPDH mRNA). (c) Liver α-GPD was measured in the mitochondrial fraction. The animals were treated as described in the legend to Figure 2. Values are the mean ± SD of three to four mice. *P < 0.05 vs. control animals; **P < 0.05 vs. hypothyroid animals, by one-way ANOVA.

