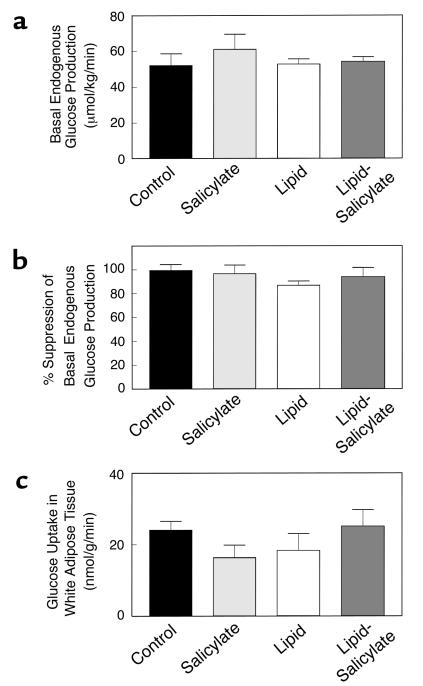
Figure 4.
Insulin action in liver and epididymal white adipose tissue in the control (black bars), salicylate (light gray bars), lipid (open bars), and lipid-salicylate rats (dark gray bars). (a) Basal rates of endogenous glucose production. (b) Percent suppression of basal endogenous glucose production during insulin-stimulated state. (c) Insulin-stimulated glucose uptake in epididymal white adipose tissue. Values are means ± SE for six to seven experiments.

