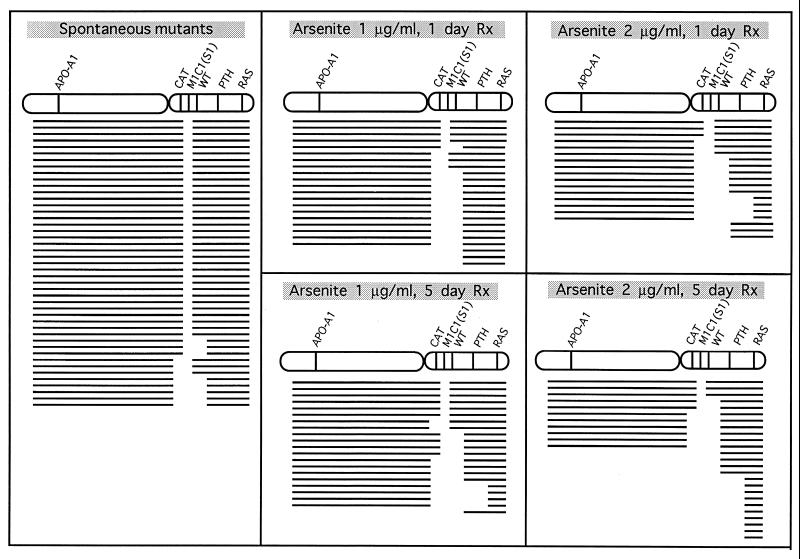
Figure 4.
Deletion spectra of S1− mutants of spontaneous origin or from cells exposed to graded doses of sodium arsenite for either a 1- or a 5-day treatment period. Each line depicts the spectrum of a single independent mutant. The absence or presence of markers among the mutants was determined by multiplex PCR using DNA from S1− mutants as templates and primers for parathyroid hormone (PTH), Wilms’ tumor (WT), catalase (CAT), apolipoprotein A1 (APO-A1), and RAS. Blank space shows missing markers.

