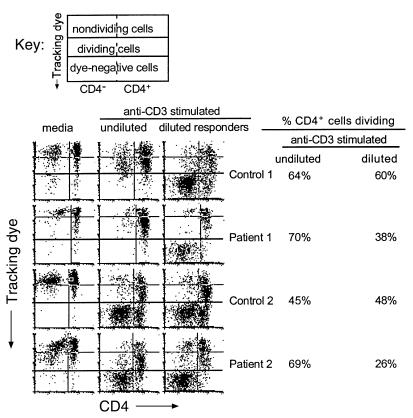
Figure 3.
Dilution of responder cells results in proliferation defects in cells from HIV-infected patients. CD8-depleted PBMCs were labeled with tracking dye and stimulated with anti-CD3 Ab for 1 hour followed by several washes. Cells were plated with unlabeled cells that had not been stimulated such that the proportion of stimulated cells to unstimulated cells was approximately 1:9 (right column). Stimulated cells were plated alone (top experiment) or with unlabeled cells that had been stimulated with anti-CD3 Ab (bottom experiment) for comparison (middle column). Unstimulated cells were used to establish background proliferation (left column). After 4 days, the cells were examined for proliferation by staining with anti-CD4 FITC Ab and simultaneously evaluating tracking dye expression. Each histogram is divided into six sections. The right and left top sections represent cells that had not divided. The middle right and left sections represent cells that had divided, and the bottom right and left sections represent the autofluorescence of cells that had not been labeled with tracking dye. Values shown to the right of the plots represent the percentages of the CD4+ cells that had divided by day 4 for the anti-CD3–stimulated cells and the anti-CD3–stimulated, diluted cells.

