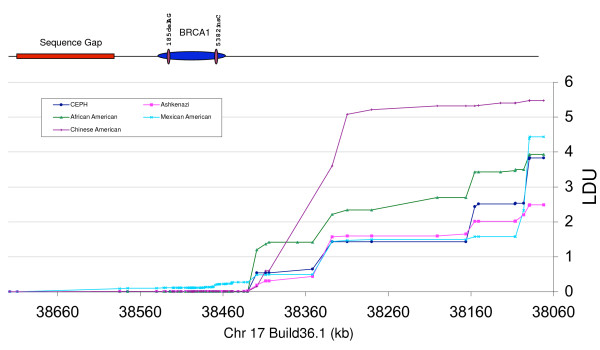
Figure 4.
LDU maps. Comparison of LDU maps across the ~650 kb region containing the BRCA1 gene for 5 populations. Top. Scale representation of the ~650 kb region studied, indicating the BRCA1 gene, founder mutations, and genome sequence gap of unknown true size. Bottom. LDU maps for five populations.

