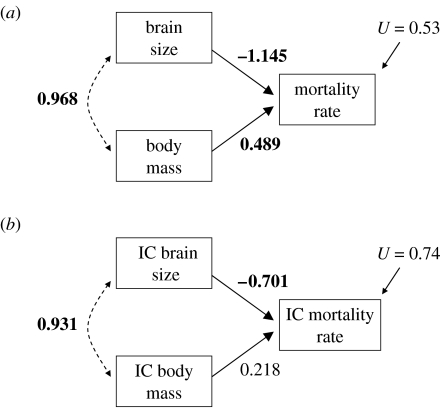
Figure 2.
Path diagram of expected causal relationship between brain mass, body mass and mortality rate at the species level (a) without and (b) with phylogenetic corrections using the independent contrast method. Dashed lines with the double-ended arrow indicate correlations and solid lines with a single arrow indicate path coefficients. Bold numbers refer to significant values at 0.05 level.

