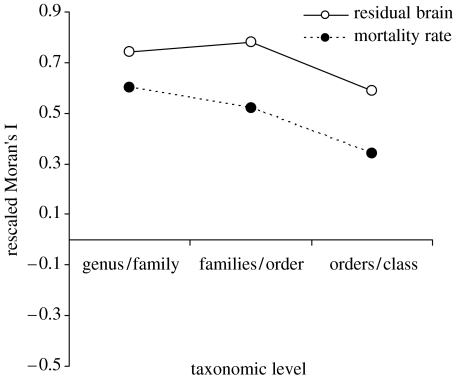
Figure 3.
Phylogenetic correlogram illustrating the results of a Moran's I procedure conducted on residual brains (n=1974 species) and mortality rates (n=236 species). All values are significantly higher than 0, according to a randomization test, indicating phylogenetic autocorrelation. The y-axis represents rescaled Moran's I (where I is rescaled for comparability across taxonomic levels); the x-axis is the taxonomic level, where genus/family indicates genera within families, and so on).

