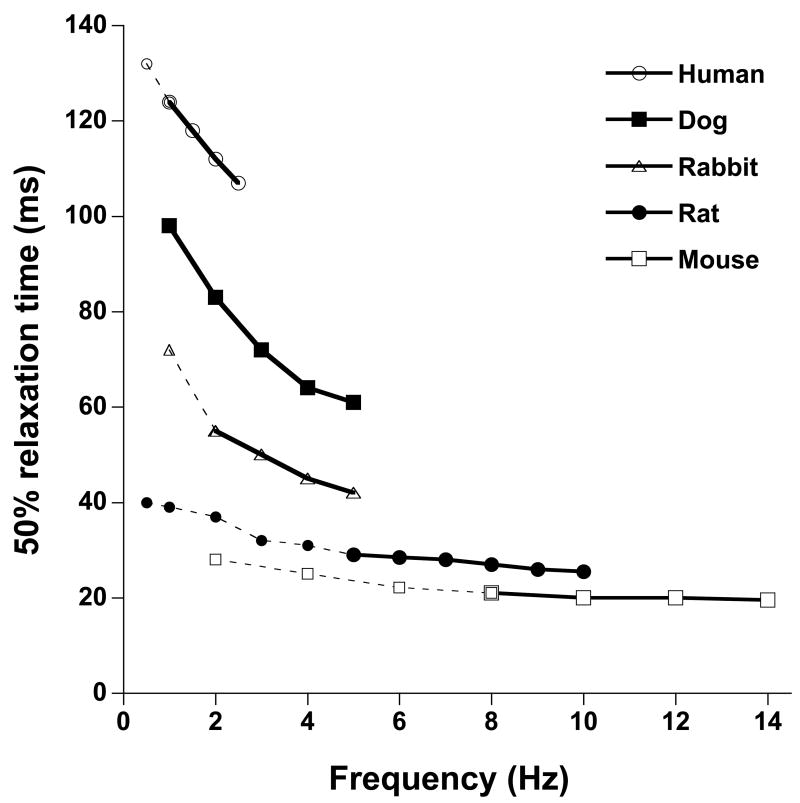
Figure 2.
Comparison of frequency dependent acceleration of relaxation in various species. All data are representative averages obtained in isometric contraction/relaxations of small and thin ventricular trabeculae at 37 °C under near identical conditions (n=4–12/species). Over the entire frequency range, encompassing the in vivo frequency range (solid lines), relaxation (indicated by time form peak tension to 50% relaxation) was accelerated when frequency increased. Both in absolute times as well as relative to the lowest rate, within the in vivo range of the species, FDAR is most pronounced in the larger mammals, but can clearly be observed even in small rodents.

