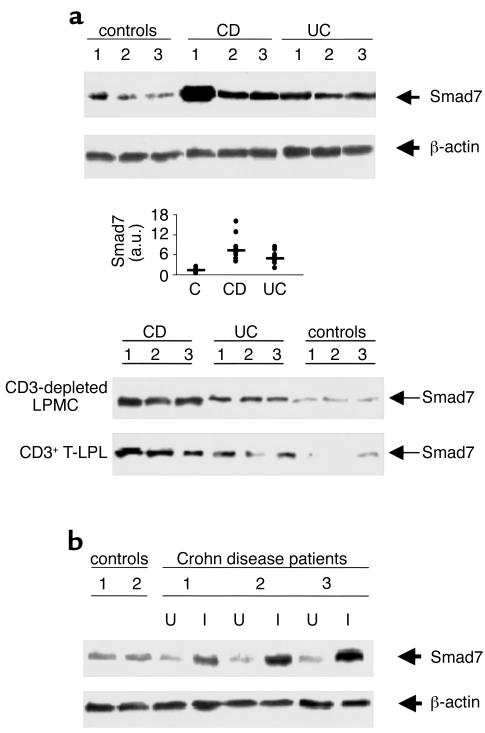
Figure 1.
Smad 7 in IBD. (a) Representative expression of Smad7 (upper blot) and β-actin (lower blot) protein in colonic mucosal samples taken from three normal controls, three patients with active CD, and three with UC. The example is representative of five separate experiments analyzing in total mucosal samples from eight patients with CD, eight with UC, and eight normal controls. Quantitative data are shown in the middle panel as measured by densitometry scanning of Western blots. Values are expressed in arbitrary units (a.u.). Each point represents the value (a.u.) of Smad7 in mucosal samples taken from a single subject. Horizontal bars indicate the median value. Shown in the bottom panel is expression of Smad7 protein in both CD3-depleted LPMCs and positively selected CD3+ T lymphocytes (T-LPL) from intestinal mucosal samples taken from three patients with CD, three patients with UC, and three normal controls. The example is representative of three separate experiments analyzing Smad7 in both CD3-depleted LPMCs and CD3+ T-LPLs from five patients with CD, four with UC, and six normal controls. (b) Expression of Smad7 (upper blot) and β-actin (lower blot) protein in CD: effect of disease activity. Colonic mucosal biopsy specimens were taken from two normal controls and from inflamed (I) and uninflamed (U) areas of three patients with CD. Arrows indicate Smad7 and β-actin detected by specific polyclonal antibodies. The example is representative of two separate experiments using in total samples from four controls and five CD patients.

