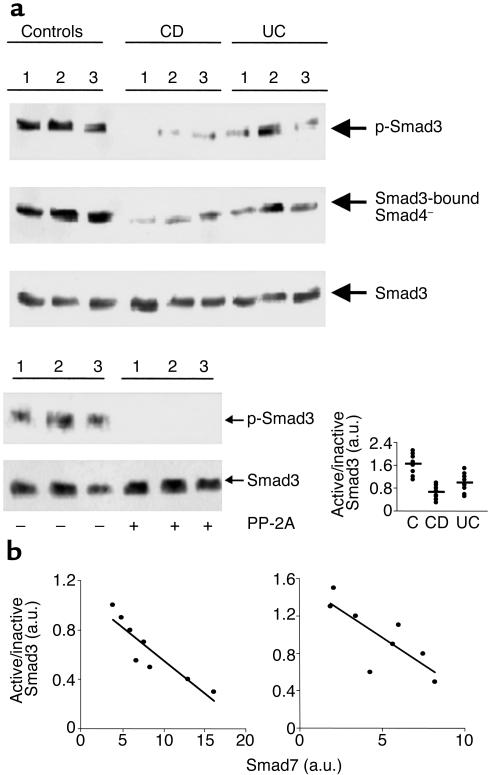
Figure 2.
(a) Reduced phosphorylation of Smad3 in IBD tissue. Active (phosphorylated, p-Smad3) and inactive Smad3 in mucosal samples of normal controls and patients with CD or UC. Total proteins were immunoprecipitated with a specific Smad3 antibody and subsequently incubated with a phosphoserine antibody (upper blot). After detection of p-Smad3, the membrane was stripped and incubated with a second Smad3 antibody (lower blot) to ascertain equivalent loading of the lanes. To investigate interactions between Smad3 and Smad4, proteins were immunoprecipitated with an anti-Smad3 antibody and subsequently incubated with a Smad4 antibody (middle blot). The example is representative of three separate experiments analyzing in total mucosal samples from eight patients with CD, eight with UC, and eight normal controls. The bottom right panel of a shows quantitative analysis of active/inactive Smad3 ratio in colonic mucosal samples from eight controls, eight patients with CD, and 8 with UC, as measured by densitometry scanning of Western blots. Values are expressed in arbitrary units (a.u.). Each point represents the value (a.u.) of active/inactive Smad3 ratio in mucosal samples taken from a single subject. Horizontal bars indicate the mean. The bottom left panel of a shows a lack of phosphorylated-Smad3 (p-Smad3) signal after treatment with protein phosphatase-2A (PP-2A). Total protein was extracted from three normal controls immunoprecipitated with a specific Smad3 antibody and incubated in the absence or presence of PP-2A. Proteins were then incubated with a phosphoserine antibody. After detection of p-Smad3, the membrane was stripped and incubated with a second Smad3 antibody to show that PP-2A does not affect the content of total Smad3 proteins. The example is representative of two separate experiments in which mucosal samples from six normal controls were used. (b) Relation between active/inactive Smad3 ratio and Smad7 in mucosal samples taken from patients with CD (left) and UC (right). Both Smad3 and Smad7 levels were measured by densitometry scanning of Western blots and expressed in arbitrary units (a.u.). The expression of Smad7 is inversely related to the active/inactive Smad3 ratio in both CD (r = 0.818; P < 0.003) and UC (r = 0.616; P < 0.03).

