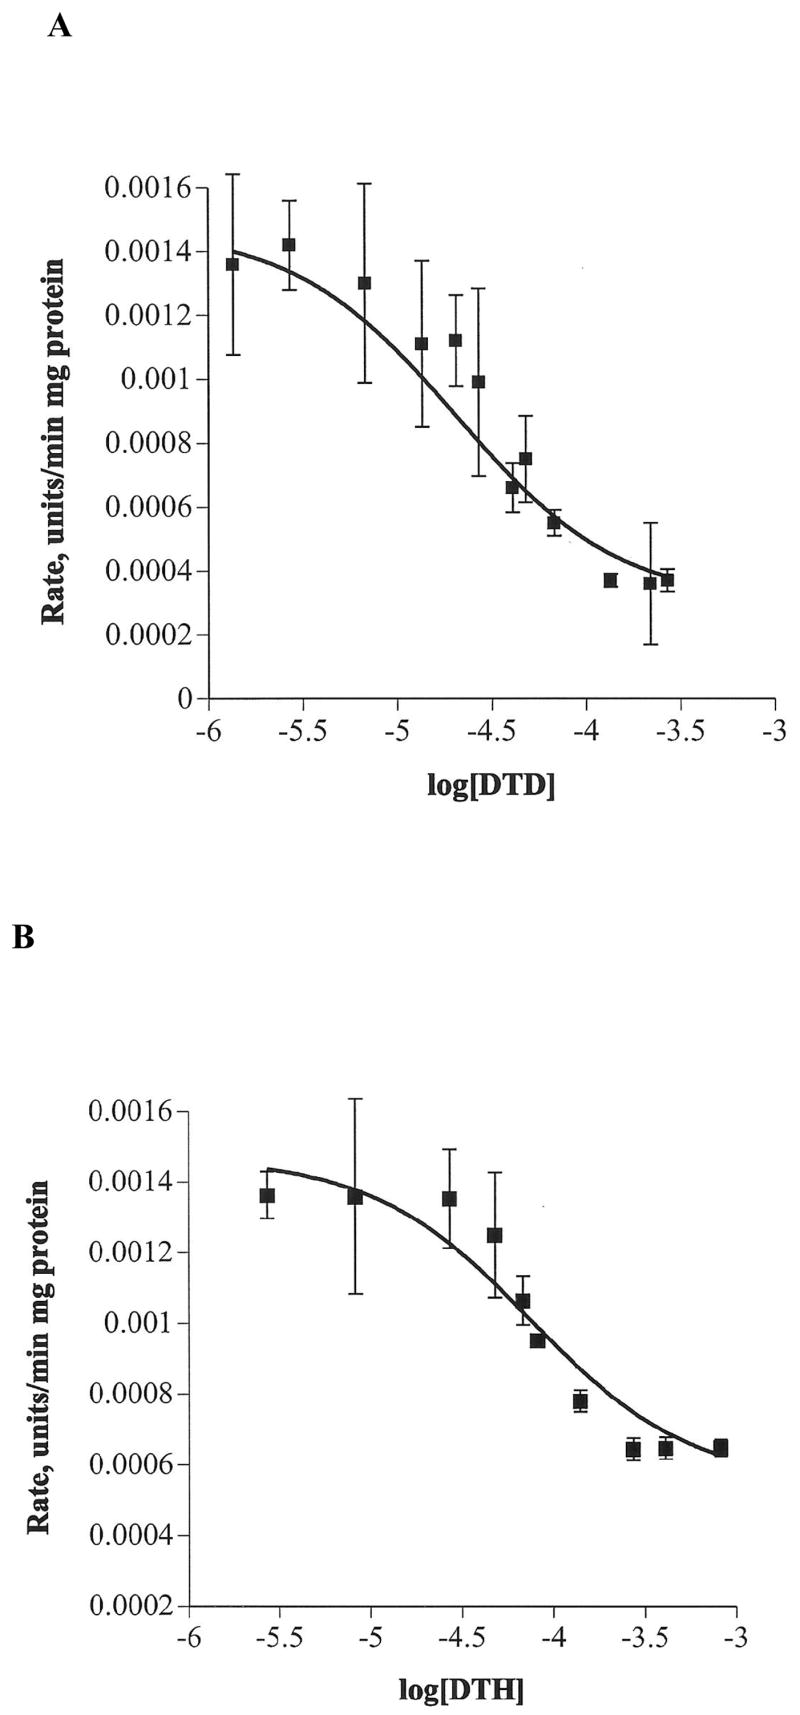
Figure 2.

Plot of the initial rate of Ch uptake normalized for protein concentration versus log[inhibitor] at 37 °C for concentrations of (A) 7 from 1.4 to 271.8 μM; R2 = 0.9311, and (B) 6 from 2.7 to 815.6 μM; R2 = 0.9294. The Ch concentration was held constant at 2 μM. Each data point on the curve is the average rate of Ch uptake obtained from three different synaptosome preparations, each of which was analyzed in triplicate.
