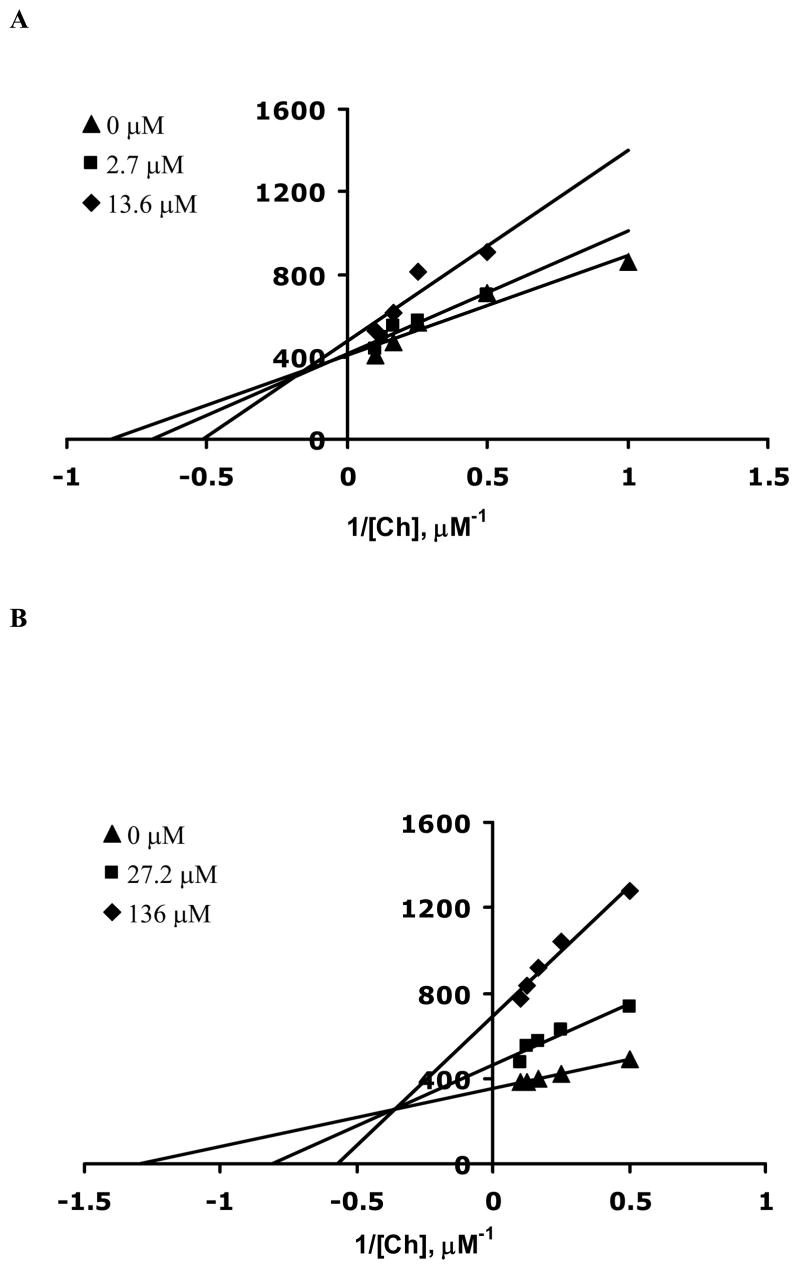
Figure 3.
Double reciprocal plots for the rate of Ch uptake as a function of Ch for three different inhibitor concentrations. (A) 7 concentrations were 0 (▲), 2.7 (■), and 13.6 (◆) μM and (B) 6 concentrations were 0 (▲), 27.2 (■), and 136 (◆) μM. Each data point is the average rate of Ch uptake determined from three different synaptosome preparations analyzed in triplicate. Error bars were removed for clarity of presentation. The average error for 6 and 7 was determined to be 9 and 12%, respectively.

