
Figure 1. Dose and time course of ROS production induced by TNF-α in human RPE cells.
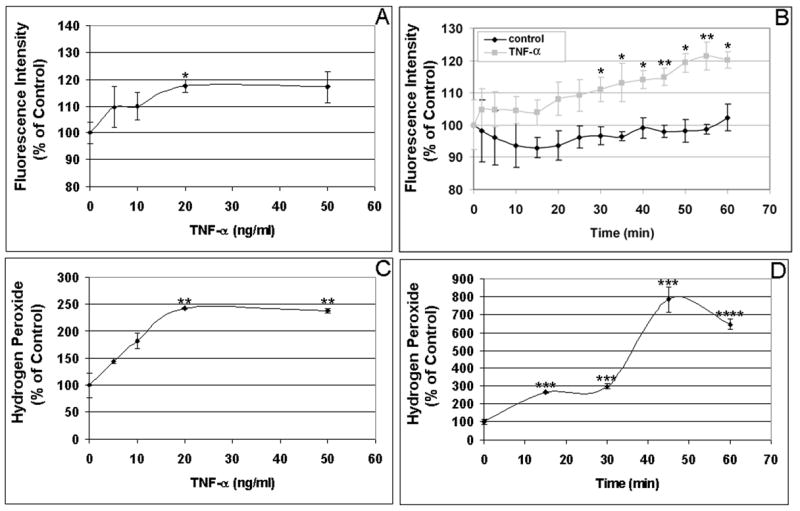
(A) Dose dependent induction of RPE intracellular ROS production by TNF-α. Cells were incubated with the indicated concentrations of TNF-α for 60 min, and intracellular ROS levels were determined by oxidative conversion of nonfluorescent reduced DCF to fluorescent DCF. (B) Time course of TNF-α-induced intracellular ROS production. RPE cells were incubated with 20 ng/ml TNF-α for 0-60 min, and intracellular ROS levels were determined by DCF fluorescence. (C) Dose response of TNF-α-induced extracellular ROS production. RPE cells were incubated with the indicated concentrations of TNF-α for 60 min, and H2O2 released by RPE cells was detected by oxidation of homovanillic acid into its fluorescent dimer. (D) Time course of TNF-α-induced extracellular ROS production. RPE cells were incubated with 20 ng/ml TNF-α for 0-60 min, and H2O2 released by RPE was detected by monitoring formation of the fluorescent homovanillic acid dimer. The released H2O2 in unstimulated control cells from three experiments were 2.25 ± 0.07 nanomoles H2O2 per million cells at 0 min, and 2.29 ± 0.14 nanomoles H2O2 per million cells at 60 min. The baseline intracellular ROS (H2O2) concentrations in the RPE cells were estimated to be around 75 nanomoles ml−1. *P < 0.05; **P < 0.01; ***P < 0.001; ****P < 0.0001, compared to unstimulated cells.