
Figure 4.
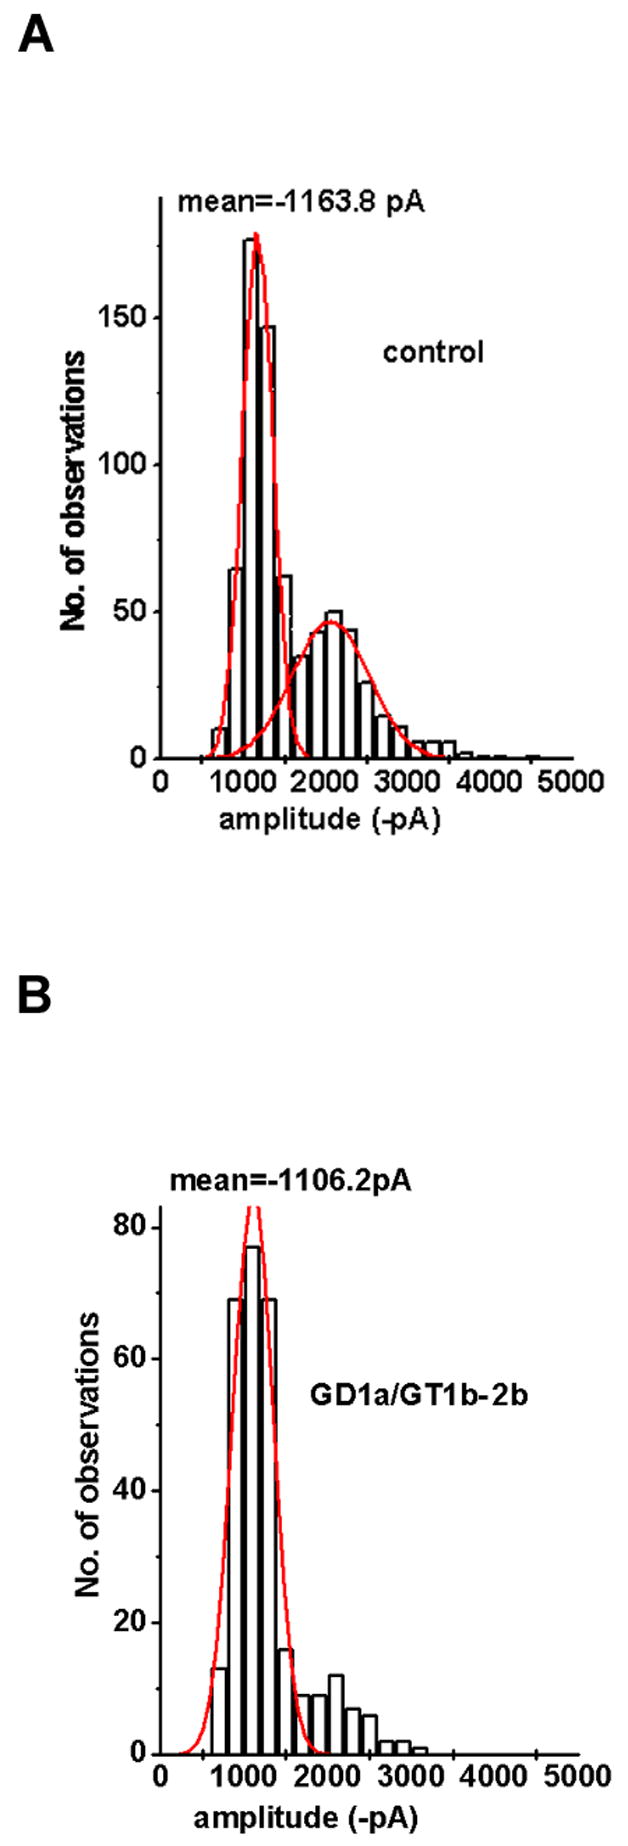
Amplitude distribution of quantal excitatory postsynaptic currents (qEPSCs) before and during application of mAb GD1a/GT1b-2b Ab. Abscissa: amplitude of qEPSCs, binwidth 200 pA. (A) Control solution. (B) mAb GD1a/GT1b-2b. Data from A and B were recorded at the same nerve terminal. The number of recordings evaluated for each distribution was 1,500 to 3,000 depending on quantal content.