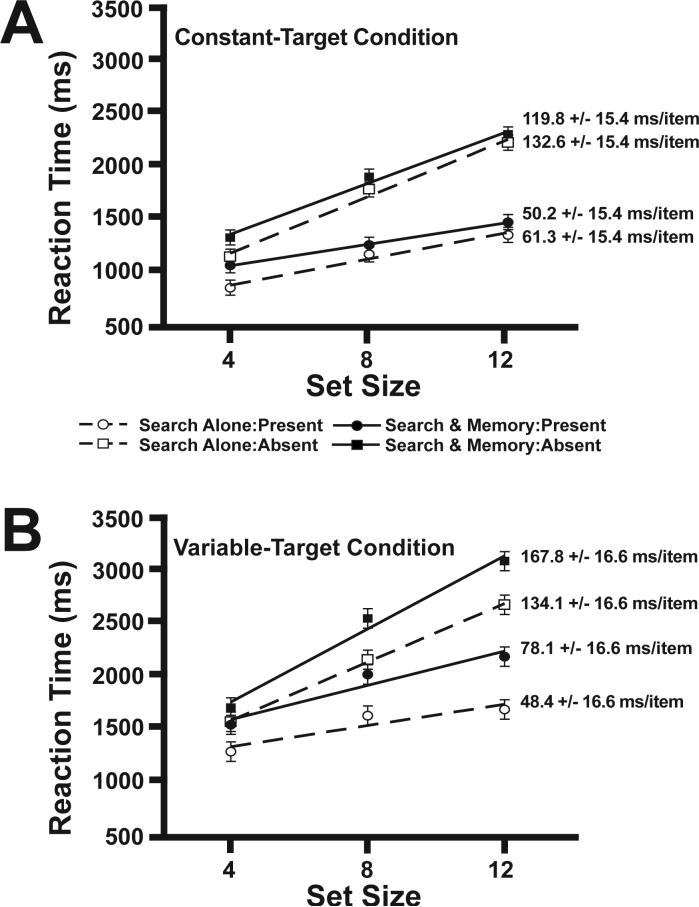
Figure 2.
Mean visual search RTs with linear regression shown. A) The visual search reaction times from the constant-target condition. B) The visual search RTs from the variable-target condition. Error bars represent 95% within-subjects confidence intervals for each group of subjects (Loftus & Loftus, 1988). To the right of each regression line is the mean slope and 95% within subjects confidence intervals.

