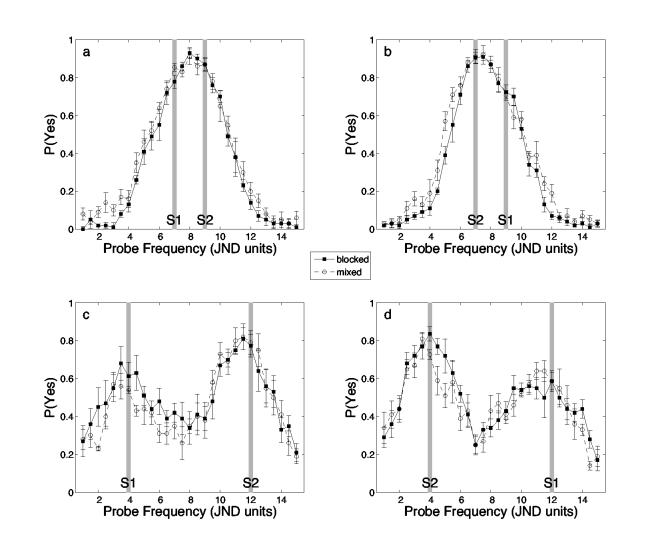
Figure 2.
Mnemometric functions: Probabilities of yes responses as p roved along the spatial-frequency dimension. Solid line for blocked group and dashed line for mixed group data. The minimum spatial frequency of p is normalized to 1. The normalized spatial frequencies of s1 and s2 are indicated by gray bars. The upper panels show data from the near conditions (|s1 – s2| = 2 JNDs); the lower panels show data for the far conditions (|s1 – s2| = 8 JNDs). The panels on the left show data from the conditions in which s1 had the lower spatial frequency of the two study items; the panels on the right show data from the conditions in which s1 had the higher spatial frequency. Error bars represent ±1 standard error of the mean.

