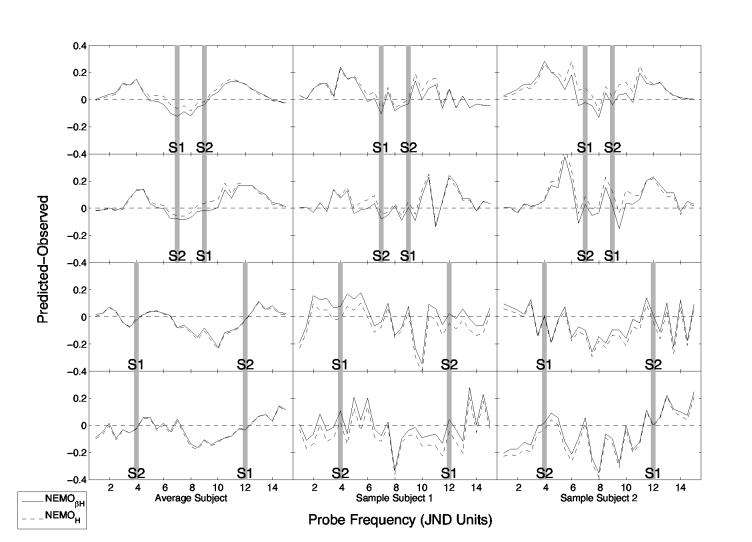
Figure 4.
Difference between predicted and observed mnemometric functions for the Heaviside variants of NEMO with and without an adjustment for interstimulus similarity (i.e., NEMOβH and NEMOH). Residuals in the lefthand column are based on averaged data, and those in the middle and righthand rows are based on individual subjects' data. The normalized spatial frequencies of s1 and s2 are indicated by gray bars. The panels in the upper two rows show data from the near conditions (|s1 – s2| = 2 JNDs); the panels in the lower two rows show data for the far conditions (|s1 – s2| = 8 JNDs).

