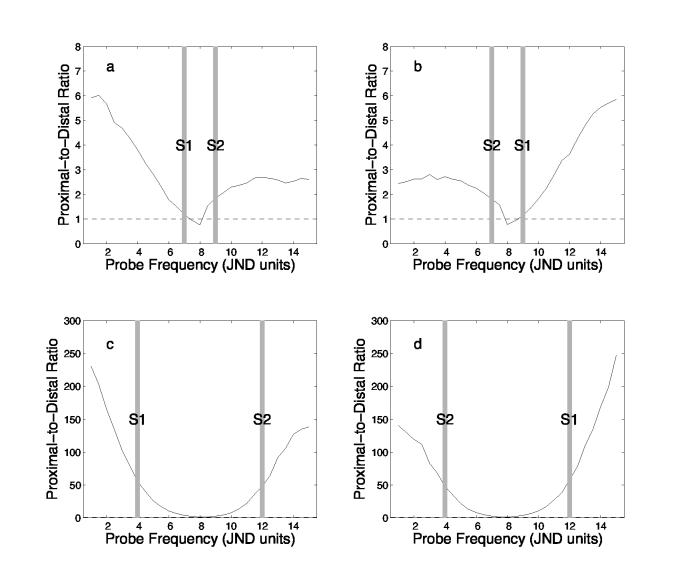
Figure 5.
Relative contributions of proximal and distal items to summed similarity. Each panel shows p's similarity to the proximal study item divided by p's similarity to the distal study item as a function of probe position for one of the experimental conditions. The normalized spatial frequencies of s1 and s2 are indicated by gray bars. The upper panels show data from the near conditions; the lower panels show data for the far conditions. The panels on the left show data from the conditions in which s1 had the lower spatial frequency of the two study items; the panels on the right show data from the conditions in which s1 had the higher spatial frequency. The dashed line highlights the region of each curve where proximal and distal items contribute similarly to summed similarity. The values used are the mean over 5000 repetitions of NEMOβE using the parameters given in Table 2.

