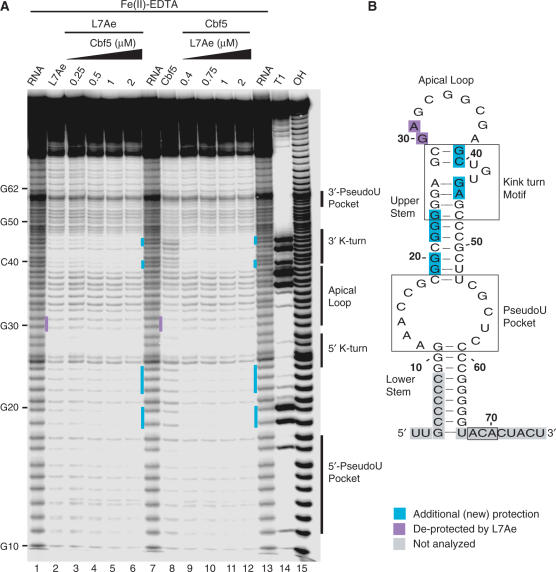
Figure 3.
Hydroxyl radical footprinting of Cbf5–L7Ae–Pf9 complexes. (A) 5′-end labelled Pf9 was incubated in the absence (lanes 1, 7, 13) or presence of either 1 μM L7Ae (lane 2) with increasing concentrations of Cbf5 (lanes 3–6), or 2 μM Cbf5 (lane 8) with increasing concentrations of L7Ae (lanes 9–12), and subjected to hydroxyl radical cleavage. Lanes 14 and 15 are size markers generated by alkaline hydrolysis (OH) and RNase T1 digestion (T1). Turquoise and purple bars indicate new sites of protection observed in the presence of both proteins and of Cbf5 protections lost upon addition of L7Ae, respectively. (B) Summary of changes in protection in the context of Pf9 RNA secondary structure model (as in Figure 1).

