Figure 1.
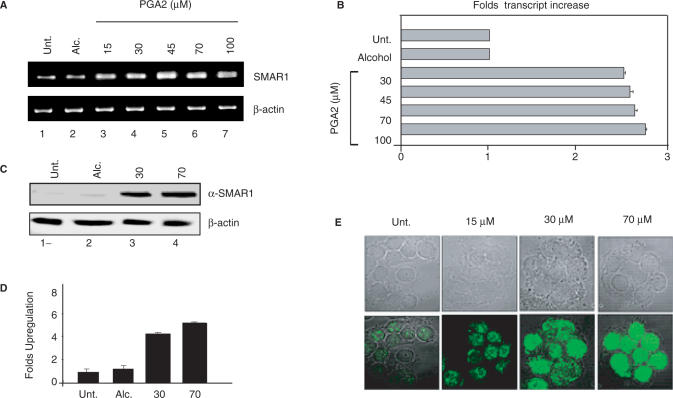
PGA2 induces SMAR1 expression. (A) MCF-7 cells were treated with vehicle (alcohol) and various concentrations of PGA2. Total RNA was obtained from aforementioned samples and used for reverse transcription. SMAR1 and β-actin transcript levels were studied using 1 μl of cDNA in RT–PCR (B) SMAR1 transcript was quantified from the above obtained cDNA by real-time–PCR analysis. Bar graphs represent the fold changes in the transcript after PGA2 treatment. (C) Western blot analysis of SMAR1 and β-actin was performed from PGA2-treated or vehicle-treated MCF-7 cell extracts as indicated. (D) Densitometry analysis for protein expression of SMAR1 reveals that protein levels increase by 3.8- and 4.5-fold upon 30 and 70 μM PGA2 treatments. (E) Immunostaining of MCF-7 cells using anti-SMAR1 antibody was performed upon PGA2 treatment at 15, 30 and 70 μM concentrations. All the results represented indicate the average of three independent experiments.

