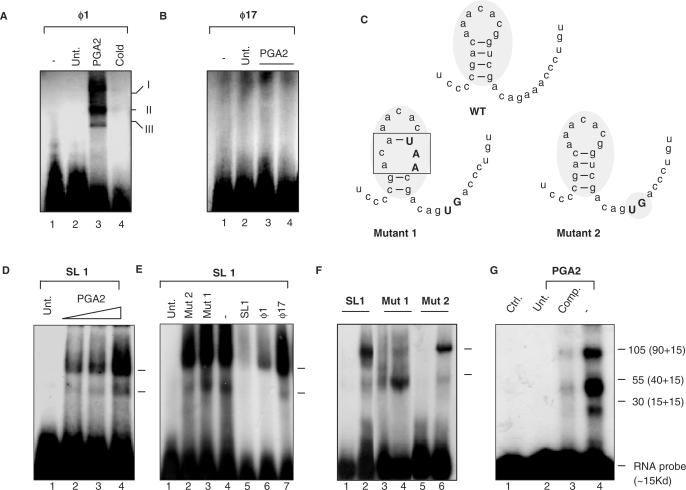
Figure 4.
SMAR1 UTR binds to complexes in a PGA2-dependent manner. EMSAs for different UTRs were performed as described in Materials and Methods section. (A) PGA2 induces ribonucleoprotein complex formation (indicated as I, II and III) on SMAR1 5′ UTR probe. PGA2 treatment (70 μM) induces RNP complex formation on the 5′ UTR of ϕ1 (lane 3). Ten-fold molar excess cold self-competitor demonstrates the specificity of the complex (lane 4) (B) The ϕ17 5′ UTR of SMAR1 does not show any complex formation under the same conditions (lane 1: free probe, lane 2: cells only, lanes 3 and 4: 30 and 70 μM PGA2 treatment). (C) Depiction of the secondary structure of the wild-type and the mutant 18-mer. The upper case fonts indicate the mutated residues and the shaded box represents the change in the secondary structure. (D) The synthetic stem–loop structure of ϕ1 UTR (SL1) shows complex formation upon PGA2 treatment in a dose-dependent manner. (E) Competition studies using specific and nonspecific competitors on SL1 to show the specificity of complex formation upon PGA2 treatment. (lane 1: free probe, lane 2: Mutant 2, lane 3: Mutant 1, lane 4: no competitor, lane 5: SL1, lane 6: ϕ1, lane 7: ϕ17). (F) SL1 and Mutant 1 and 2 were used as probe as EMSAs performed upon PGA2 treatment. Mutant 1 showed a drastic reduction in the nucleoprotein complex formation (lanes 3: untreated cell lysate, lane 4: PGA2 treated cell extract) while Mutant 2 (lane 5: untreated cell lysate, lane 6: PGA2-treated cell lysate) showed a similar albeit a lesser complex formation to SL1 (lane 1: untreated cell lysate, lane 2: PGA2-treated cell extract), indicating the importance of the intact secondary structure for complex formation. (G) Samples were prepared as mentioned in ‘Materials and Methods’ section and subjected to UV cross-linking. After incubation, samples were size fractionated using SDS–PAGE. Three predominant species of ∼105, 55 and 30 kDa were resolved and observed (lane 4). Specific cold competitor (lane 3) and probe alone (lane 1) were then used to validate the complex formation. The actual molecular weights was obtained by deduction of 15 kDa (the molecular weight of ∼45 nt RNA) from these and the correct sizes identified to be ∼90, 30 and 15 kDa.

