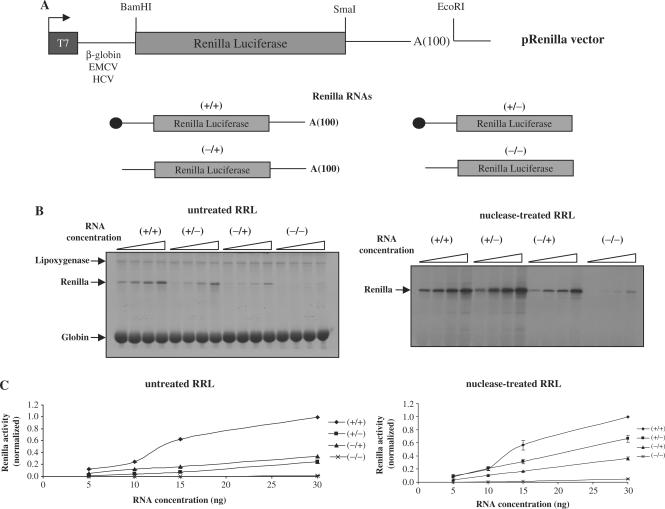
Figure 1.
(A) Schematic diagram, not to scale, of the constructs used in this study. The cap structure in the RNAs is indicated by a black circle, the 100 nt length poly(A) tail is indicated by A(100). (B) Capped/polyadenylated (+/+), capped/non-polyadenylated (+/−), uncapped/polyadenylated (−/+) or uncapped/non-polyadenylated (−/−) Globin-renilla RNAs were translated at 0.05, 0.1, 0.15 or 0.3 mg/ml in the untreated RRL (left panel) or the nuclease-treated lysate (right panel) as described in Materials and Methods section. Translational products were analysed by 15% SDS–PAGE and autoradiography. Synthesis of endogenous globin and lipoxygenase together with exogenous renilla products are indicated by arrows on the figure. Densitometric quantification of renilla synthesis at 0.1 mg/ml from Globin-renilla RNA translation in the untreated and nuclease-treated lysates has been plotted at the bottom of each panel. (C) Capped/polyadenylated (+/+), capped/non-polyadenylated (+/−), uncapped/polyadenylated (−/+) or uncapped/non-polyadenylated (−/−) Globin-renilla RNAs were translated at 0.05, 0.1, 0.15 or 0.3 mg/ml in the untreated RRL (left panel) or the nuclease-treated lysate (right panel) as described in Materials and Methods section. Renilla luciferase activity was then determined and normalized as described in Materials and Methods section. The results presented are representative of three independent experiments are expressed as means ± SD.

