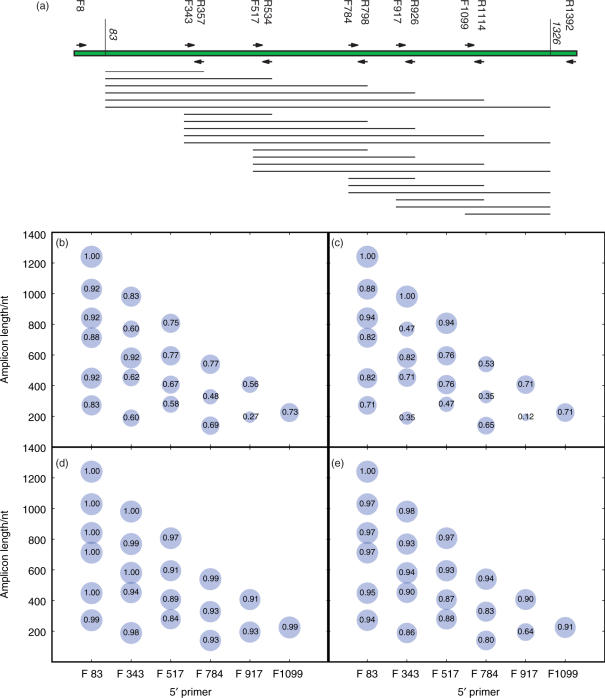
Figure 2.
UniFrac clustering with artificially shortened amplicons tends to recapture the same patterns as the full-length sequences. (a) Primer sequences as in Figure 1a, showing the artificial amplicons that were obtained by clipping the sequences using each primer pair. Sequences were truncated at positions 83 and 1326 (relative to the E. coli sequence) because this was the limit of the amplified region of the near-full-length sequences in the three samples (human, mouse, Guerrero Negro). Each line shows one of the sequences that represents a bubble in the other panels. (b) and (c) Cluster recovery rate for the clipped sequences using all three data sets, or only the mouse data set, respectively. The size of each bubble is proportional to the recovery rate, and the number inside each bubble shows the recovery rate (i.e. the fraction of nodes in the cluster that were recovered using the clipped sequences). The x-axis shows the starting primer, and the y-axis shows the length of each amplicon. Surprisingly, although longer amplicons generally gave better cluster recoveries, some long amplicons gave very poor cluster recovery (e.g. F343-R1114 recovered only 47% of the nodes in the cluster diagram for the mouse data set). (d) and (e) Pearson correlation coefficients between the pairwise UniFrac distance scores using the full-length sequences and each set of clipped sequences from all three data sets, or from only the mouse data set, respectively. In general, the correlation between the UniFrac distances was very high even when the cluster recovery was low, suggesting that UniFrac distances are robust to primer choices (although the details of the clustering in the tree can be relatively sensitive, especially in nodes that were not jackknife-supported). Results for the Guerrero Negro data set and the human data set alone were essentially identical (data not shown).

